RIFE FREQUENCIES: FINDING THE
ACTUAL
ULTRASOUND FREQUENCIES TO KILL A MICROBE
LECTURE
GIVEN BY GARY WADE ON
AT THE RIFE CONFERENCE
HELD
IN
(This lecture has been slightly modified and
lengthened for the internet presentation (11/1/99).See links below for contact
information)
FREQUENCIES TO KILL VARIOUS
PATHOGENS
UNDER
A MICROSCOPE
1)
Microbe / parasite targets which are rampant in the environment.
2)
Mechanism and method of microbe destruction.
3)
Needed Equipment to accomplish task.
4)
Experimental techniques
5)
Suggested lethal ultrasound frequencies
Microbe
/ parasite targets which are rampant in the environment
The parasitic
microbes / parasites listed in 1a) and 1b) are fairly common throughout much of
the world. Humans are quite susceptible to all of these microbes / parasites
and regularly contract infections of one or more of them. In general you can
think of multiples of tens of millions of people and or animals currently
infected with each listing of 1a) and 1b). Rife type technology can dispose of
these microbes / parasites easily and quickly. Let us move quickly to end this
needless suffering. Pick several microbes you would like to find the lethal
ultrasound frequencies for.
Lists
1a and 1b
1a)
Water Supply Microbes / Parasites
Hookworm,
Whipworm ( Trichuris Trichiura )
Protoza
- Cryptosporidium, Giardia, Ameba (Entamoeeba Histalytica)
Flukes
- Fasciala, Paragoniums, Heterophyes, Schiistosoma,
Metagonemus,
Alaria, Opisthorchis, Dicracoelium
1b)
Pet and Live Stock Microbes / Parasites
Hookworm
(Ancylostoma Canibum), Roundworm (Toxocara Canis,
Toxo
cara Cati), Pinworm (Enterobius Vermicularis), Dog Heartworm
(Dirfilaria
Immitis)
Trichinosis
(Trichinella Sprirais)
Protoza
- Toxoplasma gondii, Isospora, Pneumocystiis, Dientamoeba,
Chilomastix,
Sarcocystis, Balantidium, Cryptosparidium,
Babesia,
Retortamonas, Neopora caninum, Trichomanas
vaginalis,
Giardia, Aegieria, Acanthamoeba, Entamoeba
gingivalis,
Entamoeba histolytica
Tapeworms
- Taenia saginata, Cyticercosis, Taenia soolium, Diphyllo-
bothrium
latum, Dipyiidium caninum, Hymenolepsis
nana,
Hymenolepsis diminuta
Flukes
- Fasciola, Paragonimus, Heterophyes, Schiistosoma,
Metogonemus,
Alaria, Opisthorchis, Dicrocoelium
Spirochetes
- Spirochaeta, Saprospira, Cristispira, Trreponema,
Treponema
palladium
Mechanism
and method of microbe destruction
About half the
viruses that infect plants and animals have a outer coat (capsid) which has an
intrinsic geometry as illustrated in Figures 1A and 1B. In animals the outer coat (capsid) of the
virus is also covered with a bi-lipid layer obtained from the infected host
cell from which the virus budded off of. Other virus types that will not be talked
about here have analogous or similar symmetries and periodisities which make
them also susceptible to easy disruption and distruction from specific
frequencies of ultrasound.
In Figure 2A the black dots represent spheroid shaped large single protein molecules.
Usually two or more types of protein spheroids make up the virus capsid coat.
These large protein molecules are deformable and are elastic in nature. Figures 2B and 2C illustrate the periodically spaced, elastically
coupled, closed on themselves protein clump structures that are formed when
Figure 2 is folded into an icosahedral of Figure 1B.
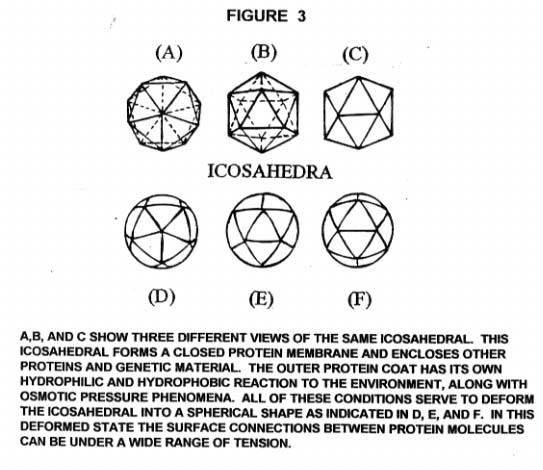
When real viruses
of the structural type as illustrated in Figure 1B are in living tissue they
are deformed into spheroids. This is do to the interaction of the virus capsid
with the environment. The bi-lipid coat on the surface of the capsid has an
affinity with water and this tends to deform the capsid into a sphere and with
tension on the surface. The capsid and its outer coat forms a simi- permeable membrane
an the phenomena of osmotic pressure causes the capsid to expand and be under
tension. There are other hydrophobic and hydrophilic reactions that can cause
and contribute to capsid deformation. Figures 3A through F illustrate this situation.
The bonds between
adjacent protein molecules in the virus capsid coat are generally hydrogen
bonds and these are relatively weak chemical bonds. To a first approximation we
can treat each protein clump (molecule) in the capsid coat as a simple harmonic
oscillator as illustrated in Figure 4C. Imagine in Figure 4C that the center of mass is a steel ball. Imagine
that that steel ball has two elastic cords attached to it and that the cords
are attached to the ceiling and floor respectfully. And furthermore, the
elastic cords are under some tension. Now imagine that the ball is pulled back
and let go. The ball will oscillate back and forth at some constant frequency.
If the tension is now increased in the cords and the ball is again pulled back
and let go, the ball will again oscillate back and forth at a constant
frequency, but now at a higher frequency. In fact the frequency of oscillation will
vary approximately proportional to the square root of the tension in the cords
for small displacements from equilibrium of the ball. If the ball is exposed to
some small rythmic driving force of the same frequency of oscillation that is
natural for the mass of the ball and the tension in the cords present, then the
amplitude (displacement from equilibrium) of oscillation will increase until
the energy release into the surrounding environment by the motion of the ball
and cords per oscillation cycle equals the energy being supplied per cycle by
the rhythmic force. However, the larger the amplitude (displacement from
equilibrium) of the oscillation, the larger the stress on where the elastic
cords are attached. If the cords are not well secured to the ceiling or floor,
the cords may decouple before the system goes into equilibrium with the
rhythmic driving force. In the case of the periodically spaced, elastically
coupled, and closed on themselves virus capsid sub- structures of Figure 4A, the "floor " and "ceiling" connections are weak
hydrogen bonds between adjacent protein clumps of the virus capsid. Figure 4E illustrates the most stressful standing wave oscillation mode on a ten
member protein clump ring. In this oscillation mode adjacent protein clumps are
oscillating 180 degrees out of phase, that is as one protein clump is moving
upward from its equilibrium position the adjacent clumps are moving down ward
and visa versa. This type of oscillation mode puts maximum tension / stress on
the weak hydrogen bonds holding the protein clumps to each other. At some
relatively small displacement amplitude the hydrogen bonds will fail and the
ring / capsid coat will disintegrate. Rife observed viruses exploding like
little hand grenades when they were exposed to their mortal oscillation rate
(MOR).
Figures 5B, C, and D illustrate several standing wave oscillation
modes that a ten member protein clump ring can support. Maximum stress /
tension occurs at the location of standing wave nodes and the weakest regions
on the protein clump ring is where the clumps bond together with mainly
hydrogen bonds. That is approximately half way between adjacent protein clump
centers of mass. Therefore, we see that the oscillation modes illustrated in
Figures 5B and D are very destructive where as that of 5C is only marginally
destructive.
Figures 6A and B illustrate two more very simple virus capsid
coats. By following the instructions and building the capsid coat models, you
can see how many types of periodically spaced, closed on themselves protein
clump structures you find and also how many overlapping and tangential closed
protein clump structures you can find. RIFE MACHINE INFO
Needed
Equipment to Accomplish Task
a)
Microscope with TV camera
b)
B and K 10 MHz sweep function generator
c)
VCR with time readout on video tape capability
d)
Sweep controller box (see Alteronics below)
e)
Ultrasound transducer that mounts on microscope stage (see Alteronics )
f)
TV monitor
g)
20 MHz oscilloscope (optional)
Alteronics
- Equipment available from Alteronics (1-5530-589-4926). And ask about their new
combination sweep function generator and controller box unit built for just
this type of experimental research.
A great deal of
very useful work can be done at relatively low magnification (~400 power) when
dealing with one cell animals and multicell parasites. However, when trying to
find the lethal ultrasound frequencies for bacteria much higher power is needed
(1,200 to 2,500 power) and some special light staining technique such as Rife
used are very helpful and definitely needed for good research results (finding
the lethal ultrasound frequencies).
Experimental
Techniques
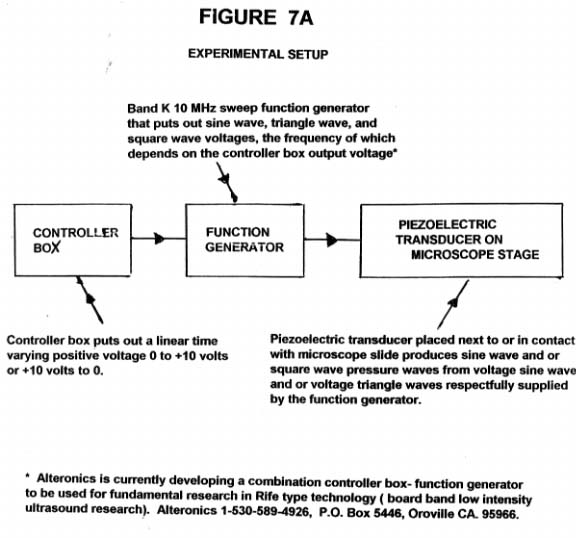
Figure 7A is the conceptual flow chart for carrying out the
experimental research.
The intensity
(energy / area / time ) of ultrasound output of the piezoelectric transducer of
Figure 7B is a very non-linear function of the peak to peak
voltage of the driving voltage signal. The intensity goes as the fourth power
of the peak to peak driving voltage. For example, if the peak to peak voltage
of a sign wave driving voltage is doubled, the sign wave pressure wave output
intensity is increased by a factor of
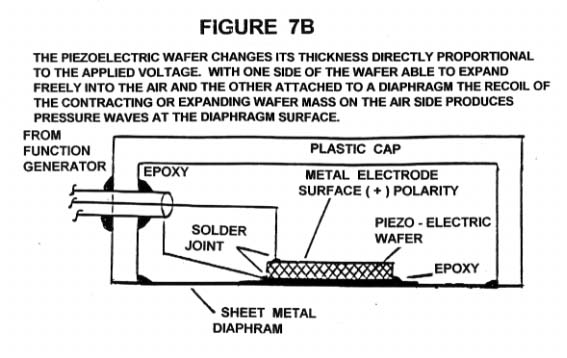
16 = (2)(2)(2)(2).
It is only the sine and cosine voltage wave forms which are transformed into
cosine and sine wave pressure waves respectfully (see Figure 8). All other voltage wave forms are transformed by the piezoelectric
transducer into another type of wave form. For example, a voltage triangle wave
form is transformed into a pressure square wave form by the piezoelectric
transducer (see Figures 9A and B).
All commercially
available piezoelectric transducers have an effective cut off frequency above
which they can not produce significant and generally useful ultrasound output.
The best commonly available PZT piezoelectric transducers that I use, start to
quickly lose their ultrasound producing ability a little above 12 MHz. To get
around this short coming there is a trick. That is to use a voltage triangle
wave form at a frequency below the cut off frequency of the piezoelectric
material being used and use the hidden higher frequency ultrasound components
in the generated pressure square wave to kill the microorganism. Figure 9C, D, and E illustrate the first three hidden Fourier
components in the pressure square wave of Figure 9B which was generated by the
transducer being supplied with the voltage triangle wave form of Figure 9A.
Figures 10A and 10B show the power absorption / power radiated verses
frequency curves for some mechanical resonators / oscillators. The curve of
Figure 10B where b=bo is a more realistic looking shape for real viruses, which
are in general the easiest structures to destroy do to their high symmetry.
Everything stated in the caption of Figure 10A still holds true, only it is
more obvious in Figure 10A.
Here are the
technical details for implementing the experimental setup shown in the flow
diagram of Figure 7A, to kill specific microbes.
Examples of
scanning technique
1) The controller
box going from 0 to +10 volts in time T and connected to VCG input on B and K
sweep function generator set to 10 MHz.
For our purposes
we need to know the relationship (the particular equation) between frequency
(F) and time (t) in the experimental run when the controller box voltage starts
at 0 volts and linearly progresses to +10 volts in time T. Refer to Figure 11.
F = M t + B
F = First
variable, M = Slope of line, t = Second variable, B = F axis intercept
(Frequency) (Rise
/ Run) (time)
Run = t2 - t1,
Rise = F2 - F1 , M = (F2 - F1) / (t2 - t1)
In Figure 11, F1 =
10 MHz, F2 = 2 MHz, t1 = 0, t2 = T. Using these values we obtain
M = (- 8 MHz / T).
Substituting in initial values of frequency and time ( 10 MHz and 0) into our
straight line equation above we obtain:
F = ( - 8 MHz / T
) t + 10 MHz
What this last
equation tells us is that once you place the total time (T) for the scan into
the equation you can find the frequency of the generator at any specific time
t. So using the time (t) readout on the video camera / VCR you can determine
the frequency at which the microbe came undone (dead).
2) Controller box
voltage output going from +10 volts to 0 volts in time T. See Figure 12. Using the same procedure as before we obtain:
F = ( + 8 MHz / T
) + 2 MHz
Suggested
Lethal Ultrasound Frequencies
Let us first deal
with cancer. If cancer is suspected it is important not to kill off a tumor too
quickly. If large amounts of tumor are killed off, you now have a bacterial
feeding ground which can lead to toxemia which can lead to kidney and liver
failure. So, if the suspected cancer you have is susceptible to specific frequencies
of ultrasound, as the great majority of cancers were in Dr. Royal Raymond
Rife's time, you should consider perhaps one treatment cycle every two or three
days giving the body adequate time to deal with the kill off. However, if you
live in California or some other states you must ignore this entire last
paragraph, despite my constitutional rights of free expression both verbally
and of the press. In California by law (AB 1707.1) "The sale, offering for
sale, holding for sale, delivering, giving away, prescribing or administering
of any drug, medicine, compound or device to be used in the diagnosis,
treatment, alleviation or cure of cancer is unlawful unless (1) an application
with respect thereto has been approved under Section 505 of the Federal Food, Drug
and Cosmetic Act or"... . In California, you are only allowed to treat
cancer with whole body poisoning which havily damages your immune system and is
often carcinogenic in nature, massive carcinogenic in nature radiation damage,
and disfiguring and disabling surgery. Your health and well being in
As a practical
matter, if you wish to experiment on yourself to see if you can kill off a
cancer tumor on yourself, you will need a piezoelectric transducer, possibly a
controller box, and a standard sweep function generator used by electronic
technicians. Get a sweep function generator that has a four digit LED readout
(a 10 MHz B and K unit will do). There are over a dozen ultrasound equipment
manufactures in the
(11,780,000 cycles
per second) / 3 = 3,926,666 cycles per second. Similarly, the first Fourier
hidden component is 23,560,000 cycles per second, if the triangle voltage wave
form has a frequency of 7,853,333 cycles per second. So, by slowly scanning
through these lower triangle voltage wave form frequencies, the hidden Fourier
higher frequency pressure sine waves are generated.
The third
experimental protocol is perhaps the most interesting. It has been found
empirically by several independent researchers that a pressure square wave of
2127 cycles per second can quickly destroy many types of cancer tumors.
However, as stated earlier, you do not want to kill off a tumor to quickly. A
conservative treatment approach that has achieved successful results is as
follows: Running the function generator at maximum output, place the transducer
on or near the tumor for one and one half minutes. Then wait three days to see
if the kill off was O.K. or too big ( very painful inflammation of tumor
tissue). If O.K. continue treatment . If, not then wait until all this subsides
before treating yourself again. When treating yourself again use one half the
treatment time used before. Again, wait a couple of days to see how big the
kill off was.
It is best to kill
off the cancer in small amounts over two or three months. This will allow the
liver and kidneys to do their jobs without making the body toxic. Large amounts
( 5 to 10 grams) of vitamin C can be taken daily with lots of water (minimum of
10 oz. per gram of vitamin C) to detox. A buffered vitamin C is probably best
for most people.
The actual
mechanism that kills the cancer cell when using the 2127 cycles per second
pressure square wave is not known. However, my guess is that one or more of the
Fourier pressure wave components closely matches the mechanical resonance
frequency of one or more of the cell's specific ion gates. Cancer cells have
very abnormal ion concentrations in them. If ion gates for specific ions are
opened up by these Fourier components the ion concentrations can be changed
drastically inside the cancer cell and the bi-lipid membrane potential
difference can fall drastically. If this potential difference fall is to large
the cell can not recover and dies.
Here are photo
copies of actual Rife research note book pages. A set of approximately twenty
24 such pages was supplied to me by Jasson Ringas. Table 1 is a compilation of the key frequency data for the microbes listed in
those 24 pages.
In table 2 are listed some of the standard disease treatment frequencies used by
voltage square wave generators, such as those made by John Crane. When
electrodes are used on the body, which have voltage square waves applied to
them, these voltage square waves among other things produce discontinuous
steady state ion transport in the body electrolytic fluids. This discontinuous
steady state ion transport produces sets of pressure square waves that have the
full spectrum of relative phase differences, but all centered about the same
frequency. These pressure square waves have the same center frequency as the
driving / applied voltage square wave. And just as indicated in Figure 9 there
are many hidden Fourier higher frequency components in the pressure square
wave. Using voltage square waves to produce pressure square waves in body
fluids is very inefficient. However, by using a voltage triangle wave put into
a piezoelectric transducer, much more powerful pressure square waves can be
produced. Therefore, using voltage triangle waves of the same frequency as
listed in Table 2, we can expect much quicker and dramatic results.
By using the formula given with Figure 9, you can use a standard sweep function
generator and using the sine wave output function to see which hidden Fourier
frequency(ies) are actually responsible for the dramatic results often seen.
IF YOU FOUND THIS ARTICLE OF REAL VALUE, PLEASE MAKE A HARD COPY WHILE STILL AVAILABLE.
![]()
![]()