RIFE RAY TUBE: ORIGINAL RIFE RAY TUBES
WHAT THEY DID AND
HOW TO MAKE
LECTURE
GIVEN BY GARY WADE ON
This
lecture (APPENDIX B) has been slightly
modified and lengthened for the internet presentation (
1a) Tube construction
b) Tube light output pattern relative to
electrical signal input and its ability to make sound waves (pressure waves) in
target (patient).
c) Tube as direct ultrasound generator
from activity of violent ion movement inside
discharge tube.
d) Tube as multipole field generator
which affects tube glass wall and charged particles and dielectric material in
the target (patient).
e) How ultrasound effects periodically
spaced elastically coupled and closed on themselves clumped protein structures.
2a) NEW TYPE OF "RIFE RAY TUBE"
Tube construction
b) Tube light output pattern relative to
electrical signal input
c) Tube as a multipole field generator
d) Tube as a direct ultrasound generator
e) Voltage wave forms to use with new /
old Rife tubes
f) Simple electrical circuits to use with
new / old Rife tubes
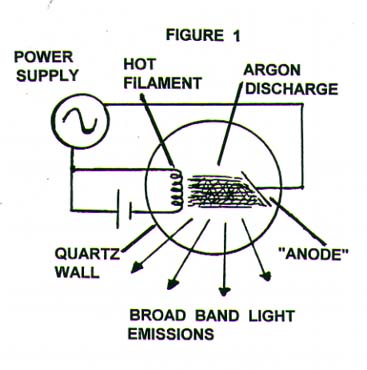
1a) Tube construction
Apparently on a
hunch Dr. Royal Raymond Rife came up with the idea of an audio to radio
frequency intensity modulated gas discharge source for destroying microbes. He
called this device a frequency instrument. The original Rife tubes used in Rife's
frequency instruments were old time X - ray tubes that had been back filled to
a low pressure with helium and or argon gas. The X - ray tube had a hot
tungsten filament and a flat metal plate surface, a few inches away from the
filament, for tube electrodes. The tube envelope was spherical and made of
fused quartz (see Figure 1).
1b)
Tube light output pattern relative to electrical signal input and its ability
to make sound waves (pressure waves) in target (patient).
The tubes were
apparently driven by two oscillators. One oscillator a sine or square wave
oscillator which supplied the driving voltage and current to the gas filled X -
ray tube. The second oscillator was of a lower frequency and was probably a
square wave oscillator used to turn on and off (modulate) the higher frequency
being supplied to the X - ray tube. This X - ray tube had a hot tungsten
cathode which gave the tube some diode characteristics. That is a preference for
current flow in only one direction. However, do to the high operating voltages
used ( ~ 900 volts RMS ) at low gas pressure, along with the ample ion /
electron generation from ultraviolet light emissions from the metastable states
of the inert gases used, the tube was electrically conductive in both
directions. Figure 1 shows a qualitative diagram of the frequency instrument.
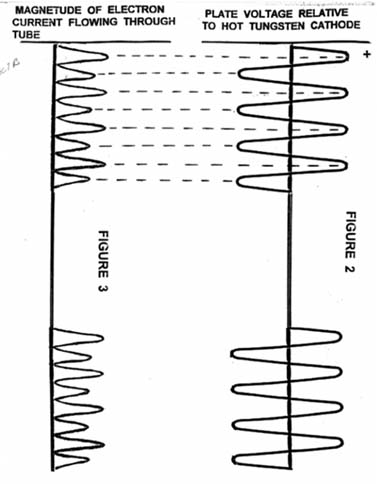
Figure 2 shows a amplitude
modulated sine wave voltage being chosen for the driving voltage for the tube. Figure 3 shows the magnitude of
electron current flow through the "diode" generated by the voltage
signal from the oscillator. The current flows in both directions, but there is
a preferred direction do to the ability of the hot cathode to easily supply
electrons when it is negatively charged relative to the plate (anode). Note
that the current flow is not proportional to the voltage. This is for two reasons.
First, the electron emission from the hot cathode is not a linear function of
plate - cathode potential difference (voltage). Figure 4 illustrates how electron
emission current depends on plate voltage and filament temperature. Secondly,
the electrons gain kinetic energy on the way to the anode and if the tube
driving voltage is high enough (and it is) the electrons gain enough energy to
be able to ionize one or more helium / argon atoms during collisions with them
while transiting the ray tube. These freed electrons join in the current flow
across the tube and also make collisions freeing more electrons. The light
emission rate from the tube which determines the light intensity is proportional
to electron collision rate with helium / argon atoms. The electron collision
rate with helium / argon atoms at a constant tube voltage is approximately
proportional to the electron current. Therefore, we should expect the light
output intensity of the ray tube to have the same shape as the electron current
magnitude of Figure
3. Also, note
that the X - ray tube wall was of fussed quartz and therefore passed
ultraviolet, visible, and upper end IR "light". Light carries
momentum and when light is absorbed or reflected there is a momentum exchange
with the absorbing and or reflecting target. This momentum exchange is
expressed as a force on the target, which is proportional to the amount of momentum
exchanged, which is proportional to the light intensity. Therefore, a light
source which produces a time varying light intensity output will produce a time
varying force (pressure wave) on / in the target.
Rife discovered
that when he would observe a microbe (be it a bacteria, rickettsia, virus, and
or protozoa) under his microscope while exposing that particular microbe to a
particular discharge pulse rate (light flashing rate) from the frequency
instrument the microbe would be deactivated. He found that all microbes had
their own specific discharge pulse rate (frequency) which deactivated them.
Rife called these their mortal oscillation rate (MOR). Note that there are two
light pulses per single complete voltage oscillation cycle. In other words there
is a frequency doubling effect here. Rife suspected that some sort of
mechanical resonance phenomena in the microbe's structure was at work in this
deactivation process. However, he apparently did not have any specifics about
what the process was. Depending on the output light intensity and the direct
tube wall ultrasound output of the frequency instrument when operated at the
MOR for a particular microbe, the microbe's reaction could vary from just
loosing its characteristic florescent or luminescent color (as seen in the
field of view of the Rife microscope) to the microbe violently exploding.
In Figure 2 we used a an amplitude
modulated voltage sine wave to drive the tube. We could of as well used a
amplitude modulated voltage square wave. The results would be similar to our
current result, but the electron current curves of Figure 3 would be more abrupt and
therefore so would be the light intensity profile. Also, the tube shock waves
generated by the oscillating current flows are stronger with voltage square
waves being used as will be discussed in the next section.
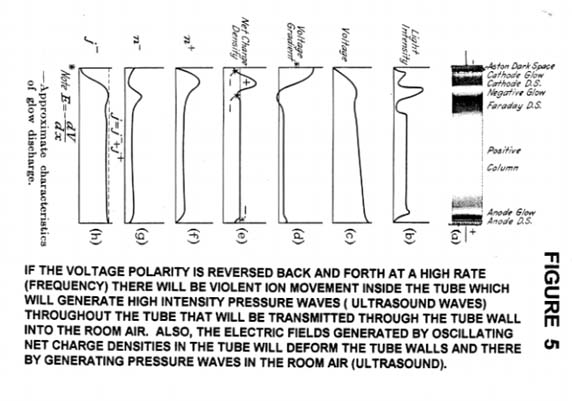
1c)
Tube as direct ultrasound generator from activity of violent ion movement inside
discharge tube.
Figure 5 illustrates the typical
conditions occurring in a steady state direct current discharge in a gas at low
pressure, called a glow discharge. Note how the charged ions separate
themselves out into steady state patterns. Now image that the polarity on the
tube electrodes was abruptly reversed. The glow discharge would immediately
reorganize itself into the mirror image of what is shown in Figure 5. This abrupt
reorganization will cause the generation of a violent shock wave inside the
tube, if the time interval for polarity reversal is significantly less than the
time it takes a normal sound pressure wave to cover the distance between the
electrodes. This shock wave generation is do to the rapid group collision
between the ions and neutral atoms / molecules during reorganization. These
shock waves will react with the tube wall deforming it and causing pressure
waves to be sent into the room air. Continuous abrupt polarity reversals on the
tube electrodes will cause the continuous production of pressure waves into the
room with a main frequency component equal to the polarity reversal rate. We
should also expect the tube to act as a resonance chamber for specific
frequencies of ultrasound generated by the shock waves.
1d)
Tube as multipole field generator which effects tube dielectric wall material and
charged particles and dielectric material in the target (patient).
Examining Figure 5e we see that there are
regions of net positive and negative charge created during the discharge
process. These net charges have associated electric fields which extend outside
the tube discharge region well into the room surrounding the tube. These
electric fields interact with the charged ions of the patient's body fluids. As
the net charge distributions oscillate back and forth in the tube, their
associated electric fields oscillate at the patient's location causing
oscillations in the force on charged particles (ions) in the patient. This
causes oscillating motion in the ions imbedded in the patient's body fluids.
This intern causes pressure waves (ultrasound) to be generated from collisions
of ions with mainly water molecules.
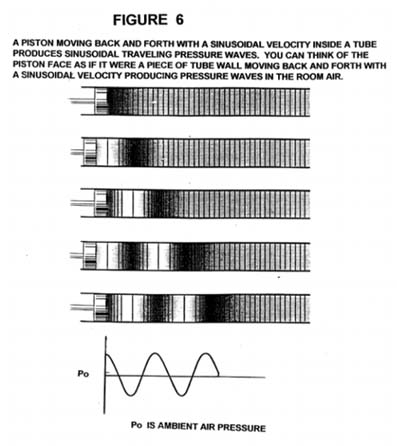
Also, it should be
noted that the dielectric material of the tube wall (fussed quartz) is
polarized / deformed by the electric fields associated with the net charge distributions
occurring inside the discharge tube. The rapid oscillating polarization /
deformations associated with the oscillating discharge current produces
ultrasound in the room air. Figure 6 illustrates how a piston
moving with a sinusoidal velocity creates a sinusoidal pressure wave in air.
The same kind of sinusoidal velocity movement of a tube wall will produce a
sinusoidal pressure wave to be sent into the room air.
1e)
How ultrasound effects periodically spaced elastically coupled and closed on themselves clumped protein structures.
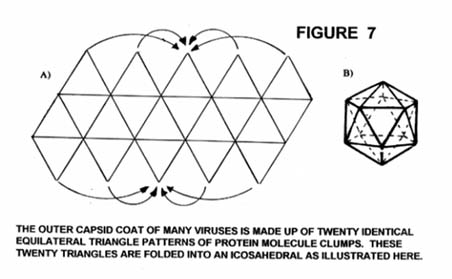
About half the
viruses that infect plants and animals have a outer coat (capsid) which has an
intrinsic geometry as illustrated in Figures 7A and 7B. In animals the outer coat
(capsid) of the virus is also covered with a bi-lipid layer obtained from the
infected host cell from which the virus budded off of. Other virus types that
will not be talked about here have analogous or similar symmetries and
periodisities which make them also susceptible to easy disruption and
distruction from specific frequencies of ultrasound.
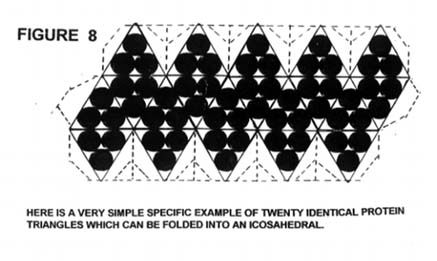
In Figure 8 the black dots represent
spheroid shaped large single protein molecules. Usually two or more types of
protein spheroids make up the virus capsid coat. These large protein molecules
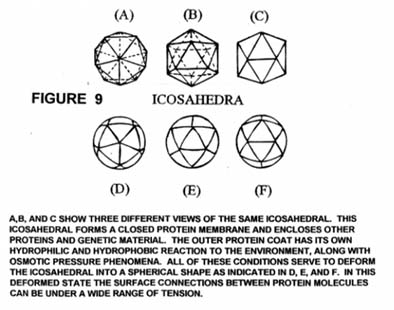
are deformable and are elastic in nature. Figures 9A, B, and C show three different views
of the icosahedral shown in Figure 7A. Figures 9D, E, and F are the deformed / expanded views of Figures 9A,
B, and C as would be caused by osmotic pressure, hydrophilic, and hydrophobic
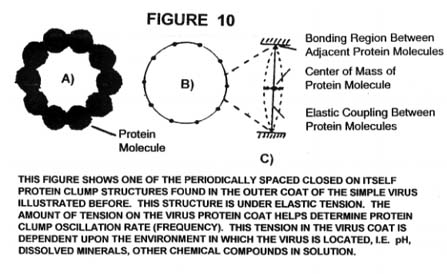
interactions of the capsid coat with its environment, for real viruses. Figures 10A, 10B and
10C illustrate
the periodically spaced, elastically coupled, closed on themselves protein
clump structures that are formed when Figure 8 is folded into an icosahedral of
Figure 7B.
When real viruses
of the structural type as illustrated in Figure 7B are in living tissue they
are deformed into spheroids. This is do to the interaction of the virus capsid
with the environment. The bi-lipid coat on the surface of the capsid has an
affinity with water and this tends to deform the capsid into a sphere and with
tension on the surface. The capsid and its outer bi-lipid coat form a
simi-permeable membrane and the phenomena of osmotic pressure causes the capsid
to expand and be under tension. There are other hydrophobic and hydrophilic
reactions that can cause and contribute to capsid deformation as was
illustrated in Figures 9D, E, and F.
The bonds between
adjacent protein molecules in the virus capsid coat are generally hydrogen
bonds and these are relatively weak chemical bonds. To a first approximation we
can treat each protein clump (molecule) in the capsid coat as a simple harmonic
oscillator as illustrated in Figure 10C. Imagine in Figure 10C
that the center of mass is a steel ball. Imagine that steel ball has two
elastic cords attached to it and that the cords are attached to the ceiling and
floor respectfully. And furthermore, the elastic cords are under some tension.
Now imagine that the ball is pulled back and let go. The ball will oscillate
back and forth at some constant frequency. If the tension is now increased in
the cords and the ball is again pulled back and let go, the ball will again
oscillate back and forth at a constant frequency, but now at a higher
frequency. In fact the frequency of oscillation will vary approximately
proportional to the square root of the tension in the cords for small
displacements from equilibrium of the ball. If the ball is exposed to some
small rhythmic driving force of the same frequency of oscillation that is
natural for the mass of the ball and the tension in the cords present, then the
amplitude (displacement from equilibrium) of oscillation will increase until
the energy release into the surrounding environment by the motion of the ball
and cords per oscillation cycle equals the energy being supplied per cycle by
the rhythmic force. However, the larger the amplitude (displacement from
equilibrium) of the oscillation, the larger the stress on where the elastic
cords are attached. If the cords are not well secured to the ceiling or floor,
the cords may decouple before the system goes into equilibrium with the
rhythmic driving force. In the case of the periodically spaced, elastically
coupled, and closed on themselves virus capsid sub-structures of Figure 10C, the "floor" and
"ceiling" connections are weak hydrogen bonds between adjacent
protein clumps of the virus capsid. Figure 11B illustrates the most stressful standing wave
oscillation mode on a ten member periodically spaced closed on itself protein
clump ring. Each protein clump is oscillating 180 degrees out of phase with its
adjacent protein clump, that is as one protein clump is moving upward from its equilibrium
position the adjacent clumps are moving downward and visa versa. This type of
oscillation mode puts maximum tension / stress on the weak hydrogen bonds
holding the protein clumps to each other. At some relatively small displacement
amplitude, the hydrogen bonds will fail and the ring / capsid coat will
disintegrate. Rife observed viruses exploding like little hand grenades when
they were exposed to their mortal oscillation rate (MOR).
Figures 11B, C,
and D illustrate
several standing wave oscillation modes that a ten member protein clump ring
can support. Maximum stress / tension occurs at the location of standing wave
nodes and the weakest regions on the protein clump ring is where the clumps
bond together with mainly hydrogen bonds. That is approximately half way
between adjacent protein clump center of mass. Therefore, we see that the
oscillation modes illustrated in Figures 11B and D are very destructive where
as that of 11C is only marginally destructive.
2)
NEW TYPE OF "RIFE RAY TUBE"
2a)
Tube construction
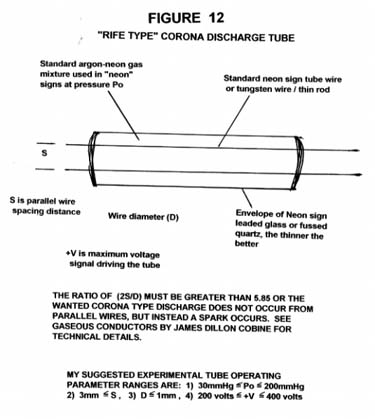
The new type of
"Rife ray tube" I am proposing has two parallel wires going down the
center of a relatively narrow and thin wall glass / quartz cylinder which is
closed off at the ends and contains the standard Neon Sign gas mixture of neon
- argon gas mixture at low pressure. >Figure 12 illustrates just such a
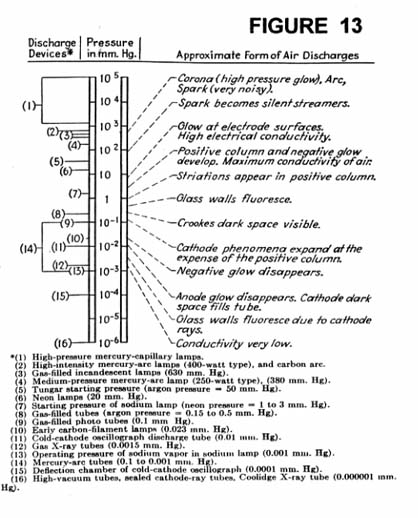
"Rife ray tube". Figure 13 shows the various gas
pressures used in the operation of various gas discharge devices. The gas
discharge phenomena which we wish to make use of in our new "Rife type
tube" is the corona discharge. The pressure range of interest is from
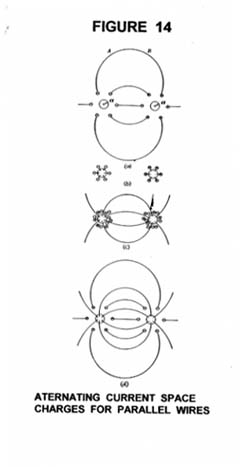
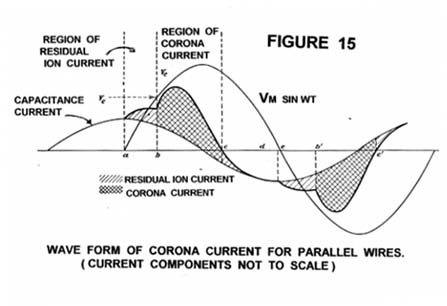
around 30 mm Hg to around 200 mm Hg. Figure 14 shows a crossectional view
of the two parallel wires running down the new tube and the qualitative ion
distributions in the gas and the charge on the wires during one voltage
oscillation cycle as illustrated in Figure 15.
In Figure 12 the ratio of (2S/D) must be greater than 5.85 or the wanted corona type
discharge does not occur from parallel wires, but instead a spark occurs. See
Gaseous Conductors by James Dillon Cobine for technical details ( pages 252 to
258 ).
2b)
Tube light output pattern relative to electrical signal input
The light output
pattern for a square wave amplitude modulated sine wave voltage driven
discharge, such as that used in Figure 2, should be qualitatively
the same for the new type of Rife ray tube. There will be subtle to not so
subtle differences depending on the various gas pressure, voltage, and
frequencies used. However, the same basic relationship between electron current
and light intensity output will still hold. That is they are approximately
directly proportional to each other. So, the same sort of time varying surface
force on the target from the time varying light intensity can be expected as
before with the old type Rife tubes.
2c)
Tube as a multipole field generator
As before in the
old type Rife tubes there will be rapidly changing back and forth net charge
configuration inside the discharge tube driven by the supply voltage. This is
clearly illustrated in Figure 14. And as before these
oscillating net charge configurations have electromagnetic fields which extend
outside the discharge tube and effect the ions in the target (patient) causing
these ions to oscillate back and forth and generate pressure waves in the
patient just as the old Rife tubes did.
2d)
Tube as a direct ultrasound generator
As before in the
old Rife type tubes the rapid reversals of electrode polarity causes ion
current flows / movements that generate shock waves in the discharge tube gas.
These shock waves in turn deform the tube wall and cause both compression and
rarefaction waves in the wall material, all of which generate pressure waves in
the room air in contact with the tube wall surface. The main frequency components
produced in the room air are the same as the tube's driving voltage, however do
to other types of plasma oscillation that can occur in this type of plasma
discharge we should not be surprised by other frequency components being
present. It should also be noted that this new Rife Tube design can produce
much stronger shock waves, which in turn can produce much stronger pressure
waves in the room air. The reason for the stronger shock waves is the close
proximity of the parallel wire electrodes, their occupation of the entire tube
length, the electrodes being close to the tube wall, and the large voltage
gradients near the surfaces of the parallel electrode wires.
2e)
Voltage wave forms to use with new / old Rife tubes
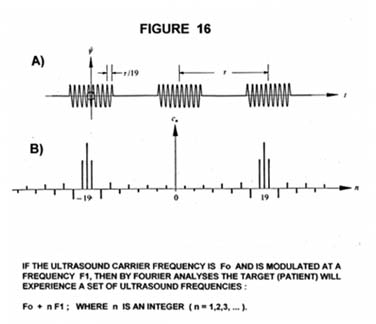
Figure 16A depicts square wave amplitude modulated pressure sine waves. The carrier
frequency is nineteen times higher than the square wave modulation frequency.
If the ultrasound carrier frequency is Fo and is modulated at a frequency F1,
then by Fourier analyses, the target (patient) exposed to this ultrasound
pattern will experience a set of ultrasound frequencies of Fo + NF1 , and Fo -
NF1 ; where N is an integer (N=1,2,3, ... ). The larger N is the smaller the
intensity of the associated pressure wave. Figure 16B is a graphical
representation of the "hidden" Fourier frequency components. The Cn
value is a coefficient which indicates the N th Fourier component's strength.
The negative N axis does not represent negative frequencies, but is an artifact
of the particular mathematical formulation used. The important thing to
understand and note is that by choosing a tube driving voltage similar in form
(shape) to that of Figure 16A, we can expect to a first approximation pressure
waves of the same form as in Figure 16A. If the ultrasound frequency which
kills a particular microbe is known, a voltage sine wave of that frequency can
be supplied to the tube to generate that ultrasound frequency. If that voltage
sine wave is amplitude modulated as illustrated in Figure 16A for the pressure
sine wave, then we can expect a ultrasound frequency spectra generated in the
target similar to that illustrated in Figure 16B. Now, if the amplitude
modulation frequency is much lower than the carrier frequency, say 1 / 1,000
the carrier frequency instead of the 1 / 19 the carrier frequency as
illustrated in Figure 16A and B, then we would expect a Fourier spectra
qualitatively similar to Figure 16B, but now with the Fourier frequency
components of significant intensity being bunched up close to the carrier
frequency. The significans of this ultrasound frequency bunching together is
that it can compensate for calibration drift in the carrier frequency and
shifts in the lethal frequency that kills the microbe because of changes in the
microbes environment, i.e. different host growth medium constituent
concentrations. In Rife's time calibration drift in the carrier frequency was a
real problem. Rife could set his carrier frequency on his frequency instrument
for let us say 1,000,000 cycles per second as determined from frequency
calibration the week before, however now do to temperature changes, humidity
changes, and mechanical vibrations with associated electrical component
movement the carrier frequency might now be 1,008,000 cycles per second. By
amplitude modulating the carrier with a square wave frequency of around 5,000 cycles
per second we create a Fourier spectra which has strong components with
frequencies within 2,000 to 3,000 cycles per second of the desired carrier
frequency of 1,000,000 cycles per second. Now if a particular microbe has a
lethal ultrasound frequency of 1,000,000 cycles per second plus or minus 4,000
cycles per second, this sort of carrier amplitude modulation is very useful and
in Rife's time apparently essential for practicle frequency instrument
operation in the doctor's office setting.
With the electronic
equipment available today we can easily slowly scan the carrier frequency
through the entire frequency range Rife used and we can do this at high power.
This allows us to use a shot gun like approach and destroy all microbes.
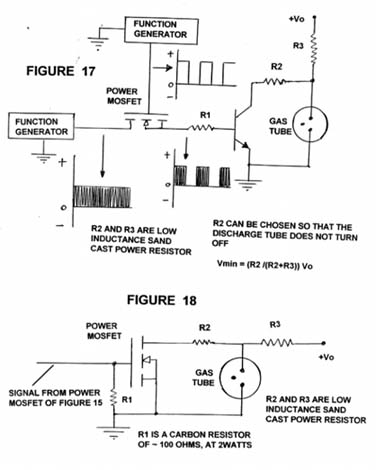
2f)
Simple electrical circuits to use with new / old Rife tubes
Figures 15 and 18 illustrate two simple
electrical circuits to be used to driver old / new type Rife tubes. The
function generators shown can be regular electronic tech sweep function
generators that have the sine wave, triangle wave, and square wave output
voltage waves. This circuits can be run in pulsed mode or continuous mode. These
circuits can be used to find the specific frequency(ies) of ultrasound to kill
particular microbes. They can also just be used in the shot gun type approach
mentioned in the last section. The use of these circuits assumes a certain
familiarity with electrical circuits and how to calculate circuit component
values. GOOD HUNTING.
IF YOU FOUND THIS ARTICLE OF REAL VALUE, PLEASE MAKE A HARD COPY WHILE STILL AVAILABLE.